Ranking Home Affordability Among America's Largest Cities
This month, August 2023 the home affordability index dropped to an all-time low. According to a report, it was recorded that in 37 states it will require at least 30 percent of a person's median annual income just to afford to make mortgage payments on a home. The publication that tracks this information called this housing market a "truly unprecedented market." In California, the amount of annual payments to afford a home jumped to 64 percent of a person's median annual income.
In case you thought that renting is a good alternative, the cost of renting also moves alongside the affordability metric of owning a home. Therefore, renting a place to live is also more expensive than it has ever been. Unprecedented is a term that often gets overused and therefore, it has lost some of its meaning. However, in this case, we truly do live in unprecedented times when it comes to the cost of living. More than ever it will be important to try to unlock as much value from our hard-earned dollars than ever before. In order to do so, people may need to be open to changing the location where they live and work. And that is why we created the following graphic where it lays out a housing affordability metric to measure affordability on a relative basis.
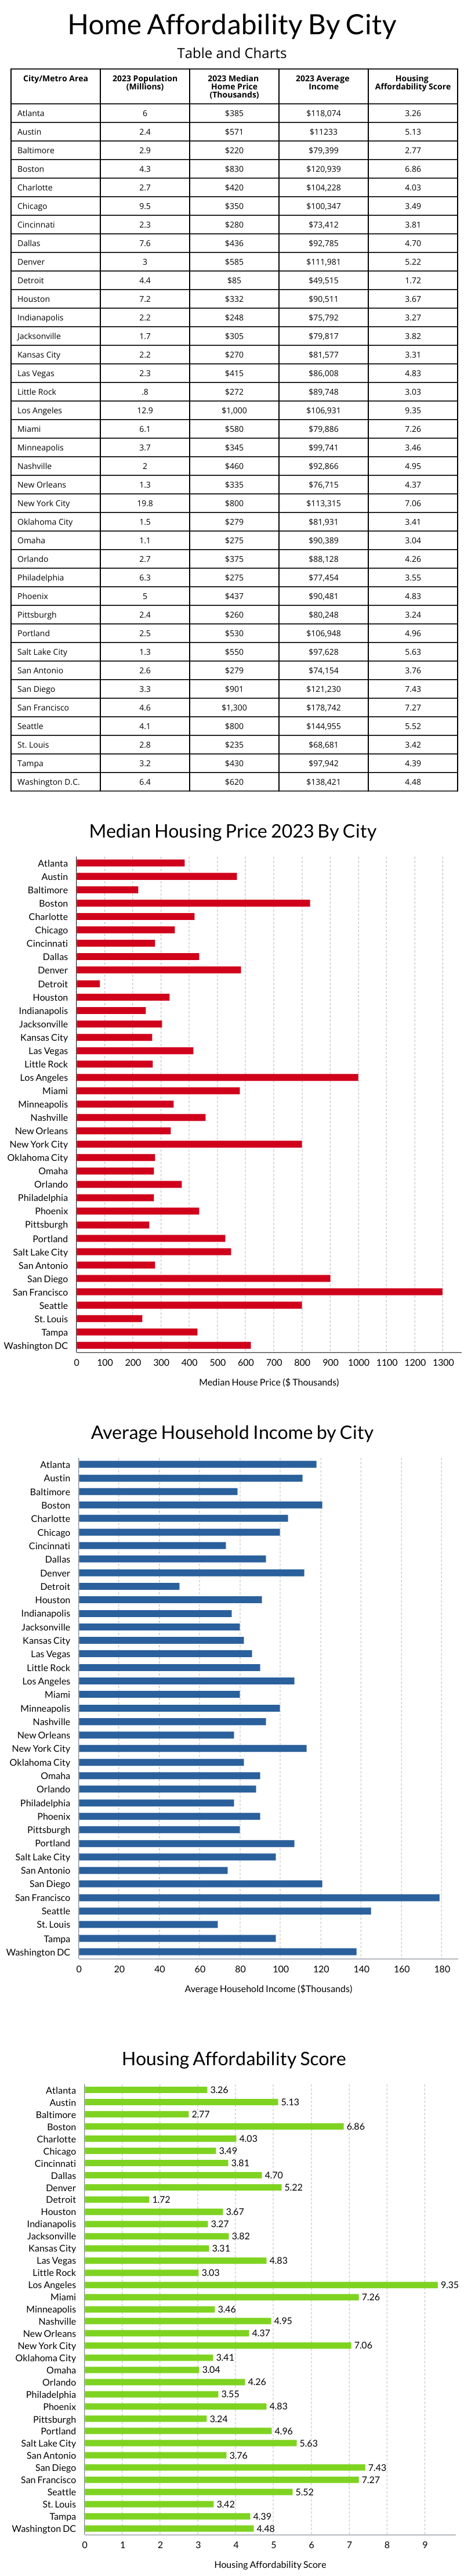
Now, before you think there was some deep analysis done to create this, think again. Simply, all this graphic does is gather information related to each city's median home price and compare it to average household income. By dividing the median home price by household average income, it arrives at a ratio of the median home price relative to a city's average income per household. It is a simple metric, but useful nonetheless. Use this as a resource, but compare it to other data before making any big, life-changing decisions.
This table and charts lists each city in alphabetical order. Below the table and charts you see here, there is listed each city's housing affordability score in ranked order from best to worst.
Sources:
World Population Review: Average Income per City
Home Affordability Rankings By City
This ranking accumulates data across thirty-seven of America's largest cities.
As you study this ranking of housing affordability, you may notice how the most affordable cities to live in are all located near the center of the country. While the least affordable housing is located on the edges, as a general rule of thumb.
Also, take note that this data used average household income and not median household income. The average household income tends to skew higher than the median so in case you think the average number is high relative to your income, it probably is. Most people will make less than the average. However, this metric is still useful for understanding the ranking of affordability among various US cities.
Housing Affordability Score Ranking
- Detroit: 1.72
- Baltimore: 2.77
- Little Rock: 3.03
- Omaha: 3.04
- Pittsburgh: 3.24
- Atlanta: 3.26
- Indianapolis: 3.27
- Kansas City: 3.31
- Oklahoma City: 3.41
- St. Louis: 3.42
- Minneapolis: 3.46
- Chicago: 3.49
- Philadelphia: 3.55
- Houston: 3.67
- San Antonio: 3.76
- Cincinatti: 3.81
- Jacksonville: 3.82
- Charlotte: 4.03
- Orlando: 4.26
- New Orleans: 4.37
- Tampa: 4.39
- Washinton DC: 4.48
- Dallas: 4.70
- Las Vegas: 4.83
- Phoenix: 4.83
- Nashville: 4.95
- Portland: 4.96
- Austin: 5.13
- Denver: 5.22
- Seattle: 5.52
- Salt Lake City: 5.63
- Boston: 6.86
- New York City: 7.06
- Miami: 7.26
- San Francisco: 7.27
- San Diego: 7.43
- Los Angeles: 9.35
We hope you found this information useful in your day-to-day living. If you need calculator tools to aid in your decision-making, here are a few that may help.